
How to Truly Build a P&L Strategy for Third-Party Food Delivery
By far the most common topic I talk about on sales calls with customers is their delivery P&L.
In the last 60 sales calls I’ve done I’ve discussed delivery P&Ls on at least 55 of them (I used AI to check.) In my view, it’s the most important topic in food delivery right now and the data bears this out.
A restaurant can post a record revenue month on delivery and keep almost nothing, because with delivery, revenue is just money passing through the business, not money kept at the end.
Too many owners track gross revenue, orders and ROAS and leave it at that. This is a fatal mistake and something I always take time to discuss with clients.
A P&L for 3rd party delivery is a unique beast that requires understanding two fundamental ideas:
- Contribution margin is the metric that determines whether you are running a profitable business
- Your marketing budget is determined by your food cost and packaging and how much commission you pay per order.
Two restaurants with identical delivery revenue can have completely different profits. Most people understand this by instinct but few really understand the specifics or why it matters.
In this post I’ll show you the exact formula for understanding what you make in profit, and how to build a P&L and marketing strategy that protects it.
Why a delivery P&L is different from a dine-in one
Search online about restaurant P&Ls and they are almost all talking about dine-in. In dine-in, the P&L is usually based around what is called prime cost ie, food + labour.
But with delivery, the cost associated with each order is different. You keep the food cost of course, but now you have app commission, packaging, funded discounts and ad spend on every order.
So the same order that is healthy P&L wise in dine-in can be break-even or negative on delivery. Also bear in mind that on delivery you can rarely pad out the margin with drinks.
This is why you need a separate delivery P&L.
The Delivery P&L aka The Cost Stack Method
Delivery apps provide a lot of useful analytics, and they are getting better all the time at surfacing useful business information for restaurant owners. However almost none automatically calculate contribution margin, so many operators default to looking at revenue and ROAS.
But contribution margin is the hero metric for your delivery P&L and everyone operating on delivery apps should be tracking it.
Contribution margin is defined as what each order ‘contributes’ towards your fixed costs and then ultimately what ends up as profit.
In food delivery we calculate it by stacking the costs associated with each order and subtracting them from the revenue generated.
The costs are:
- Food and packaging costs (COGS)
- True commission paid
- Funded discounts
- Funded ad spend
So the contribution margin formula is:
Contribution Margin = Revenue – COGS – commission – discounts – ad spend
So let’s take a very basic example.
Your revenue was 100
- Your COGS is 30%
- Your Commission is 30%
- You discounted 15%
- And spent 5% on ads
Your contribution margin is therefore 100-30-30-15-5 = 20
Ie. After all your costs you are left with 20% of your revenue to go towards fixed costs and profit.
Delivery P&L Benchmarks and Best Practices aka The 55/45 model
In the example above we saw how quickly costs associated with delivery apps can eat into your overall margin.
100 in revenue became 20 in take home cash, even with modest spending on ads and discounts.
To have an optimised P&L strategy, many restaurant operators need to adjust their thinking about delivery - especially when it comes to COGS.
In dine-in you might have a food cost somewhere between 28%-35% and be able to run a profitable business. But with the delivery that is almost always not the case.
Commissions usually remain relatively stable, and operators should budget for 30%. When you start thinking about marketing costs, it becomes clear that food cost at 30%+ for delivery will not work when it comes to a delivery P&L.
I recommend operators should always aim for the 20-25% range for food cost when building their delivery strategy.
The key insight here is that a high COGS strangles your ability to spend on marketing and visibility. After commission, with a 35% food cost, there isn’t enough left to fund visibility, ultimately throttling growth.
As a benchmark, delivery operators often need to aim for what I call the 55/45 model, where commission (30%) and food cost (25%) account for 55% of the revenue generated, leaving 45% - enough to fund visibility campaigns and be left with a decent profit at the end.
Remember 45% is not your margin. It is the budget you spend on discounts and ads to create visibility and demand on the apps. The left over is profit.
Plan from your effective commission, not the headline
There is a difference between commission rate you signed at and the rate you pay. Sometimes the difference is almost zero, but sometimes different platform fees and surcharges can push the effective commission rate higher.
Often if you build your P&L from the headline number you can be too optimistic with your planning, which in turn can lead to lower profit margins, poor use of marketing budgets and in the worst cases tip your operations from profitable to loss making.
Always build the P&L from the realised commission you are paying, not from the headline number you signed at.
Every business is different but realised commission is usually between 28%-35%, which is quite a large range. This is why I tend to benchmark commission at 30% when doing this exercise with customers.
How to spend the 45% on in app discounts and ads
Now we’ve seen that when optimised, 55% of your margin goes to food cost and commission. We already have a better understanding of how marketing spend will impact your P&L.
The obvious example is the 50% discount. A 50% discount on 45% margin and you’ve already lost money.
Many brands are sceptical of discounting because of brand perception, but nevertheless discounting remains the best way to drive visibility, order volume and new customers on delivery apps.
Use your P&L to build a model of what kind of discounting your business can sustain and always think in terms of optimisation.
- Consider which menu items have the highest margin and thus can tolerate higher discounts.
- Look at your hourly order volume to see where discounting can be used to fill spare capacity or boost shoulder hours.
- Target large (30%-50%) full menu discounts on key points of the year where demand is highest and you’re seeking to acquire as many customers as possible.
In-app ads like CPC, premium position and keyword bidding are measured with ROAS, but again you can use ROAS along with your P&L to plan budget levels.
Ads are a great way to buy visibility without giving away as much margin as discounting but can also eat into profit if you spend too much.
Most ads run on auto-bidding by default and generate a ROAS of 2-3x. As a benchmark you usually want your CPC ads to be at 3x as a profitable floor. Ideally with optimisation you can be consistently achieving 4-5x ROAS on CPC ads. With keyword ads this can be as much 8-10x with proper optimisation.
Read our blog about optimising keyword ads here.
Never Overlook Menu Conversion Rate (Especially if it’s low)
In your P&L you probably won’t have menu conversion rate as part of the calculations but it’s a metric that plays a key role in your overall success.
In food delivery, conversion rate = share of menu viewers who order.
An excellent conversion rate is over 20% and you should ideally be targeting 15-22%.
Conversion rate usually doesn’t appear in your P&L because it’s not specifically about revenue, costs or profit. But it is the only free lever you have to increase orders and make your delivery operations run as profitably as possible.
For example, lifting conversion rate from 15% to 20% is ~33% more orders from the same traffic and ad spend, no price change.
The way to think about conversion rate in terms of your P&L is to fix the leaking funnel before you turn on the tap.
As you will be using your revenue to pay for visibility, having a high conversion rate before you start spending on marketing means not wasting the precious 45% you have left over to generate more orders.
If your conversion rate hovers around 8%-10% then this is where to start before executing the strategy based on your P&L.
Main drivers of conversion rate on delivery apps are: photos, descriptions, category order, best-sellers visible, tight menu, no hidden "price on selection" and price.
How to think about fixed costs in a delivery-only business
If you run a cloud kitchen, your fixed costs are simpler than a full restaurant's, but they matter more, because you have no dining room to fall back on. Every order comes through the apps, so all of the fixed costs, ie rent, has to be paid out of your delivery contribution margin.
Start by writing down your monthly rent. For a single-brand cloud kitchen in the UAE for example, that usually looks something like:
- Kitchen rent: AED 8,000
- Kitchen staff: AED 12,000
- Utilities, licences and software: AED 5,000
- Total fixed cost: AED 25,000 a month
Now the only question that matters is how much revenue clears that total. If your contribution margin is 25% of sales (what is left after food cost, commission, discounts and ads), you divide your fixed costs by that margin:
AED 25,000 ÷ 25% = AED 100,000 in monthly sales just to break even.
Below AED 100,000 you are losing money every month, no matter how busy the kitchen looks. Above it, the maths turns in your favour fast, because the rent is already paid.
That is operating leverage, and it is the whole reason cloud kitchens can be so profitable:

Same kitchen, same staff, same rent. The only thing that changed is volume, and profit climbed from zero to 25,000.
This is why the strongest cloud-kitchen play is running several brands from one kitchen. A second or third virtual brand adds sales and contribution margin while sharing the same rent and mostly the same staff, so your fixed cost per AED of sales keeps falling.
One warning. Scale multiplies whatever your unit economics already are. If your contribution margin per order is healthy, more volume compounds profit. If it is negative, scaling just loses money faster. Get the per-order margin right first, then chase volume.
P&L Example
Here's a simple example of different scenarios you can face in a P&L depending on input + marketing costs.
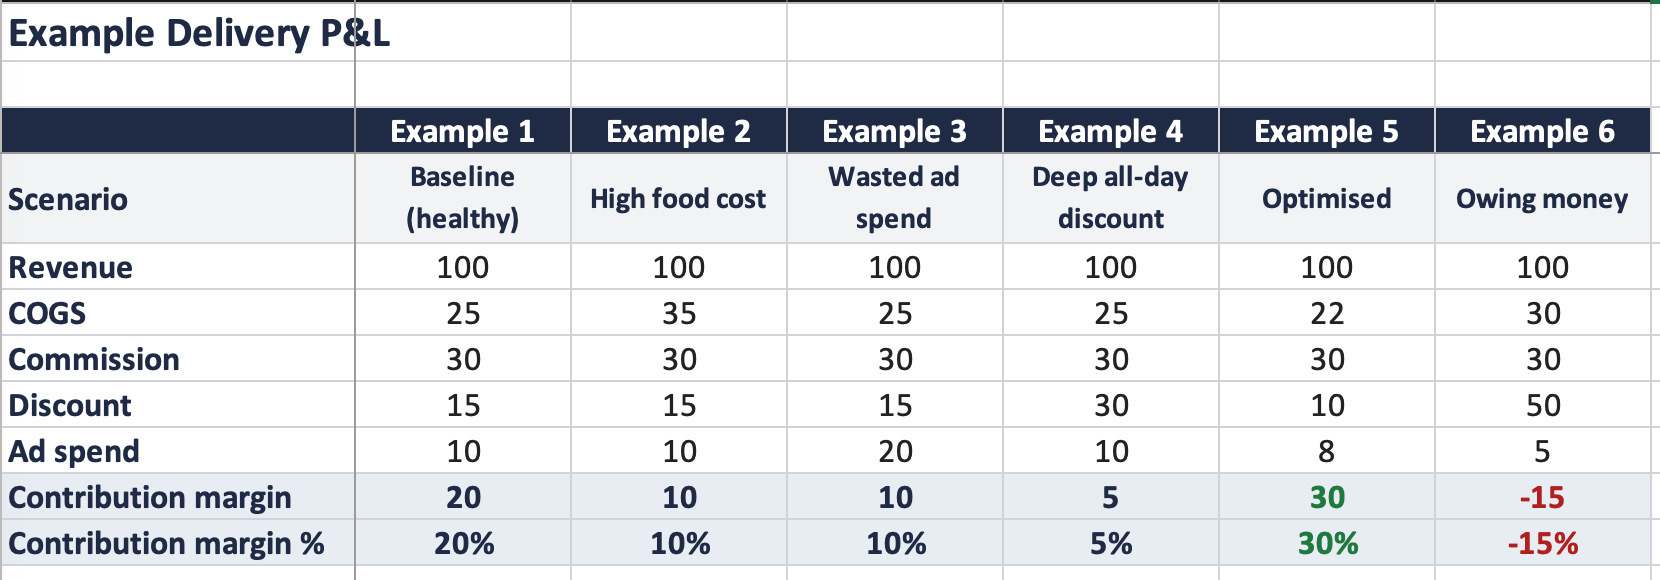
How to read it:
Example 1 (baseline): a healthy 20% contribution margin.
Example 2 (high food cost): COGS alone at 35% halves the margin.
Example 3 (wasted ad spend): auto-bid pushing ad spend to 20% does the same damage.
Example 4 (deep all-day discount): a 30% discount left running all day drops CM to near break-even.
Example 5 (optimised): tighter COGS, targeted off-peak discounting, efficient ads lift CM to 30%. The Revly outcome.
Example 6 (owing money): COGS + commission + discount + ad spend total 115, more than the order is worth, so the order loses 15 per 100.
How you end up owing the delivery apps money
With a P&L setup like this you can quickly see that there are ways you can end up owing a delivery app money.
This usually ends up happening through a combination of higher than optimal food costs, heavy discounting and then layering extra CPC ad spend on top - driving the business to a point where costs have eaten up all the revenue generated.
In the example above with a COGS of 30%, a 50% discount and adding just 5% in CPC spend pushes this restaurant deep into the negative and leaves the restaurant owing the delivery app money.
Focusing on P&L and contribution margin is the best way of developing and executing strategy on delivery apps that avoids unprofitable results.
Key Takeaways
- Contribution margin, not revenue, tells you if delivery is working.
- Target ~20-25% food cost, plan from your ~28-35% effective commission, protect the ~45%.
- Spend the 45% deliberately: discounts sized to margin and timed to demand, ads above 3x ROAS.
- Menu conversion (15-22%) is the free multiplier; fix it before spending more.
- Every order must still clear its share of fixed costs.
Revly helps delivery operators build profitable P&Ls and execute marketing strategies that work on delivery apps. We use campaign optimisation software and years of experience running successful campaigns that help brands grow.
.webp)
.webp)
.jpg)